Fig. 10
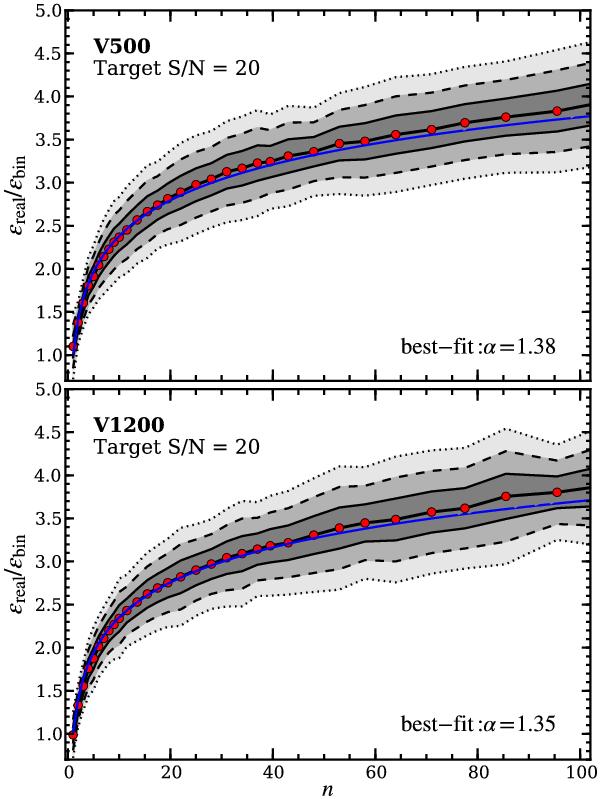
Ratio of the real error (ϵreal) to the analytically propagated error (ϵbin) as a function of number of spaxels per bin for all the V500 (upper panel) and V1200 (lower panel) data of DR1 at a target S/N of 20. Grey shades mark the 1σ, 2σ and 3σ levels. The blue lines represent the best fit logarithmic function with α = 1.38 and α = 1.35, respectively.
Current usage metrics show cumulative count of Article Views (full-text article views including HTML views, PDF and ePub downloads, according to the available data) and Abstracts Views on Vision4Press platform.
Data correspond to usage on the plateform after 2015. The current usage metrics is available 48-96 hours after online publication and is updated daily on week days.
Initial download of the metrics may take a while.