Fig. 1
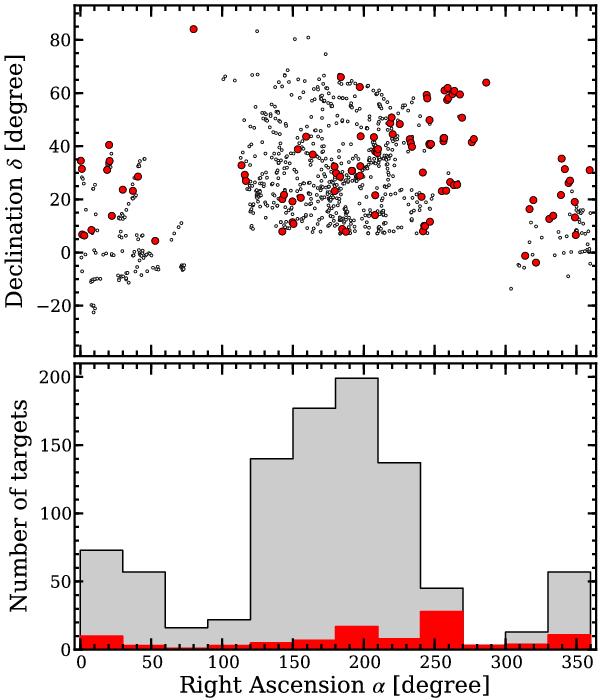
Distribution of galaxies in the CALIFA mother sample on the sky (upper panel) and as a function of right ascension (lower panel). Galaxies in the CALIFA DR1 sample are highlighted by filled symbols with red color. The number distribution in bins of 30° along the right ascension is shown in the lower panel for the mother sample (gray area) and the DR1 sample (red shaded area).
Current usage metrics show cumulative count of Article Views (full-text article views including HTML views, PDF and ePub downloads, according to the available data) and Abstracts Views on Vision4Press platform.
Data correspond to usage on the plateform after 2015. The current usage metrics is available 48-96 hours after online publication and is updated daily on week days.
Initial download of the metrics may take a while.