Free Access
Fig. 5
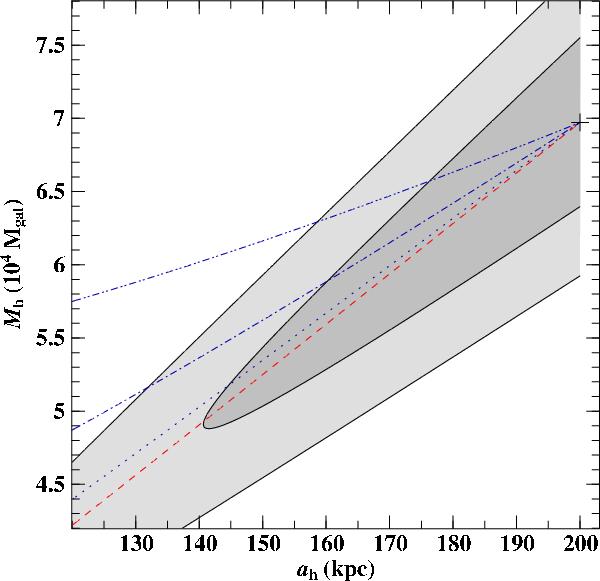
Visualization of the correlation between Mh and ah in Model II. The meaning of the cross, curves, and shaded regions is the same as in Fig. 3 except that the red dashed line defines loci of constant halo mass inside a sphere of radius 20 kpc.
Current usage metrics show cumulative count of Article Views (full-text article views including HTML views, PDF and ePub downloads, according to the available data) and Abstracts Views on Vision4Press platform.
Data correspond to usage on the plateform after 2015. The current usage metrics is available 48-96 hours after online publication and is updated daily on week days.
Initial download of the metrics may take a while.