Fig. 3
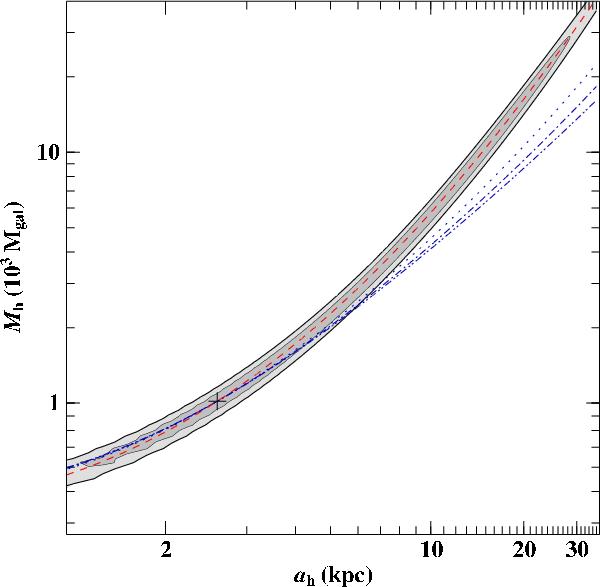
Visualization of the correlation between Mh and ah in Model I: The single parameter 90%-confidence region defined by Δχ2 ≤ 2.71 and corresponding to a 74%-joint-confidence region is black-rimmed and shaded in dark gray, while the 3σ region (Δχ2 ≤ 9, 99%-joint-confidence region) is the total black-rimmed, gray-shaded area. The cross marks the location of the best fit. The four curves define the loci of constant halo mass inside a sphere of radius 14.1 kpc (red dashed), 50 kpc (blue dotted), 100 kpc (blue dashed-dotted), and 200 kpc (blue dashed-dotted-dotted).
Current usage metrics show cumulative count of Article Views (full-text article views including HTML views, PDF and ePub downloads, according to the available data) and Abstracts Views on Vision4Press platform.
Data correspond to usage on the plateform after 2015. The current usage metrics is available 48-96 hours after online publication and is updated daily on week days.
Initial download of the metrics may take a while.