Fig. 9
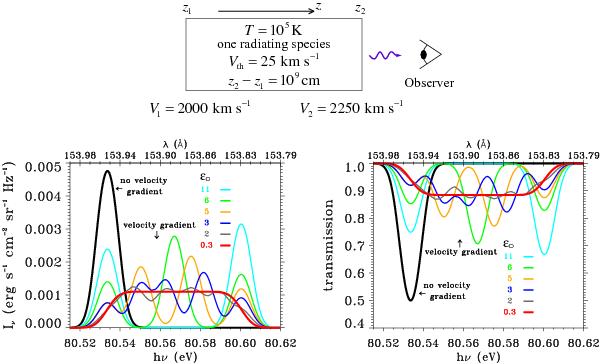
Test of the velocity gradient effect. The top panel represents a single plasma layer in a stellar wind, with a velocity gradient. The layer is at uniform temperature T, with one radiating species, assuming LTE and no scattering. The layer is modeled in IRIS with one cell between grid points z1 and z2, with wind velocities V1 > 0 (the material approaches the observer) and V2 > V1. The red thick curve in the bottom left panel displays the monochromatic specific intensity Iν, due to the radiation that emerges from the layer at z2 toward the observer, as computed by IRIS. This emission spectrum is plotted versus photon energy hν (eV) or photon wavelength λ (Å). It is obtained with a parameter ϵD = 0.3. Too large values of ϵD result in incorrect profiles, as shown by the following curves: cyan (ϵD = 11), green (ϵD = 6), orange (ϵD = 5), blue (ϵD = 3), grey (ϵD = 2). The bottom right panel displays the corresponding transmission spectrum. For comparison, the black thick curve portrays the spectral line that would obtain if there was no velocity gradient (V2 = V1). See Sect. 8.3 for detailed explanations.
Current usage metrics show cumulative count of Article Views (full-text article views including HTML views, PDF and ePub downloads, according to the available data) and Abstracts Views on Vision4Press platform.
Data correspond to usage on the plateform after 2015. The current usage metrics is available 48-96 hours after online publication and is updated daily on week days.
Initial download of the metrics may take a while.