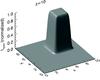
Fig. 7
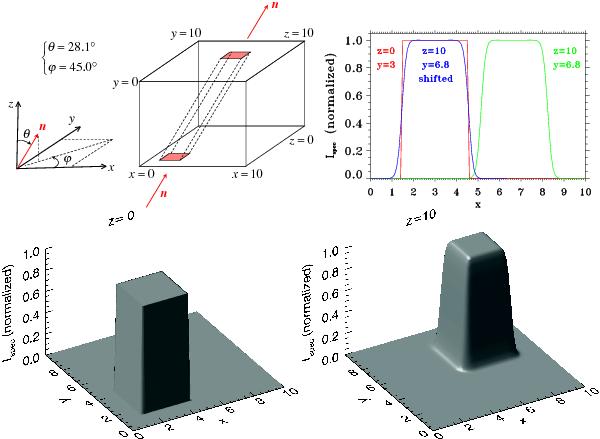
Searchlight beam test. The top left panel of the figure depicts the purpose of this test. A slanted beam, with direction n, enters a zero opacity box at its base, and emerges from it at the top. The objective is to compare the entering beam profile with the emerging one; both are theoretically the same. The bottom panels show the normalized specific intensity of the beam, as a function of positions x and y, at the bottom of the box (left panel), and at the top of the box (right panel). The top right panel displays sectional views of the beam along x-axis, at z = 0 and y = 3 (red curve), at z = 10 and y = 6.8 (green curve). The blue curve is identical to the the green one, but shifted so that its center fits the center of the red curve. See Sect. 8.1 for explanations.
Current usage metrics show cumulative count of Article Views (full-text article views including HTML views, PDF and ePub downloads, according to the available data) and Abstracts Views on Vision4Press platform.
Data correspond to usage on the plateform after 2015. The current usage metrics is available 48-96 hours after online publication and is updated daily on week days.
Initial download of the metrics may take a while.