Free Access
Fig. 2
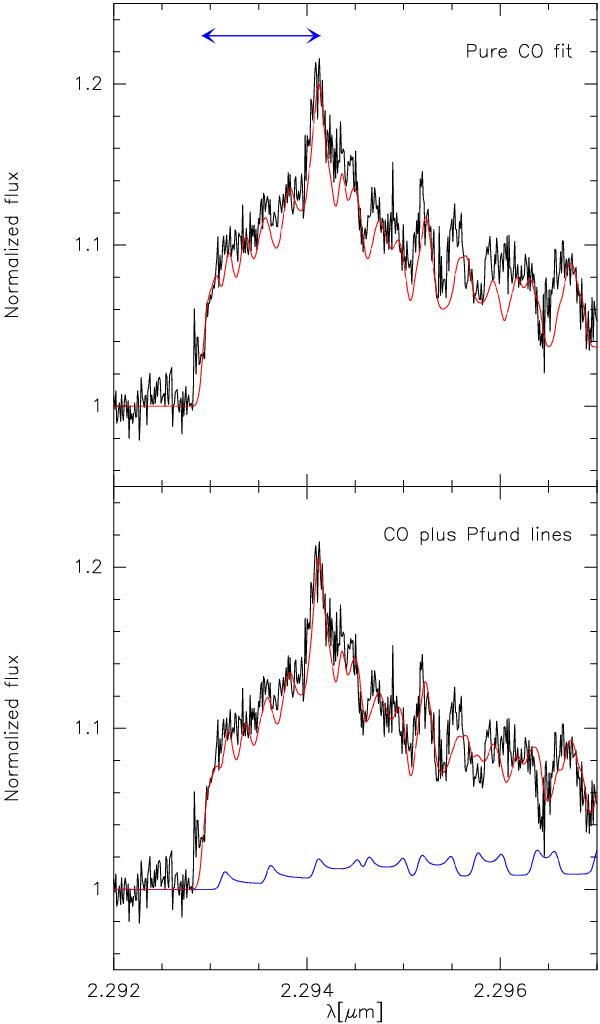
Fit (red/gray) to the observed, normalized CRIRES spectrum of GG Car (black) considering the emission to consist of either pure CO band (top panel) or CO band plus Pfund line emission (bottom panel).
Current usage metrics show cumulative count of Article Views (full-text article views including HTML views, PDF and ePub downloads, according to the available data) and Abstracts Views on Vision4Press platform.
Data correspond to usage on the plateform after 2015. The current usage metrics is available 48-96 hours after online publication and is updated daily on week days.
Initial download of the metrics may take a while.