Fig. 6
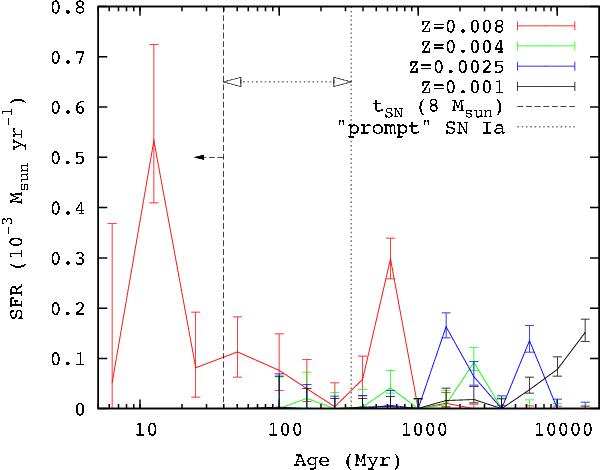
Average SFH of the 12′ × 12′ cells, centred on MCSNR J0527−7104, from the data of Harris & Zaritsky (2009). The SFH is broken into four metallicity bins as indicated in the plot key. Also shown are the time ranges from which we expect either core collapse (indicated by the dashed arrow) or “prompt” type Ia (indicated by the dotted double sided arrow) progenitors to be formed. The peak at 12.5 Myr reflects the higher recent star formation activity seen only in the northeastern cell which contains N 206. Another episode of star formation is seen ~630 Myr ago.
Current usage metrics show cumulative count of Article Views (full-text article views including HTML views, PDF and ePub downloads, according to the available data) and Abstracts Views on Vision4Press platform.
Data correspond to usage on the plateform after 2015. The current usage metrics is available 48-96 hours after online publication and is updated daily on week days.
Initial download of the metrics may take a while.