Fig. 1
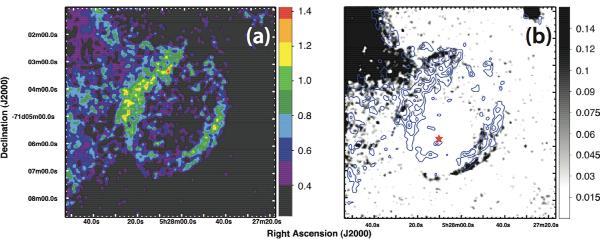
MCELS derived images of MCSNR J0527−7104. a) [S ii]/Hα ratio map with the colour scale adjusted so only regions of enhanced [S ii] are visible. The SNR is clearly seen with two prominent arcs of enhanced [S ii] located NE and SW of the centre. The emission to the east of the SNR is due to the N 206 H ii complex. b) Continuum subtracted [O iii] image of MCSNR J0527−7104. [S ii]/Hα contours are overlaid, emphasising regions where the ratio is clearly enhanced, ranging from 0.67 to the maximal value with intermediate levels of 25, 50, and 75% of the maximum. The grayscale is in units of 10-15 erg cm-2 s-1. The location of the bright foreground source HD 36877, which was masked for the continuum subtraction, is indicated by the red star. Each image has been smoothed using a 3 × 3 pixel Gaussian filter.
Current usage metrics show cumulative count of Article Views (full-text article views including HTML views, PDF and ePub downloads, according to the available data) and Abstracts Views on Vision4Press platform.
Data correspond to usage on the plateform after 2015. The current usage metrics is available 48-96 hours after online publication and is updated daily on week days.
Initial download of the metrics may take a while.