Fig. 1
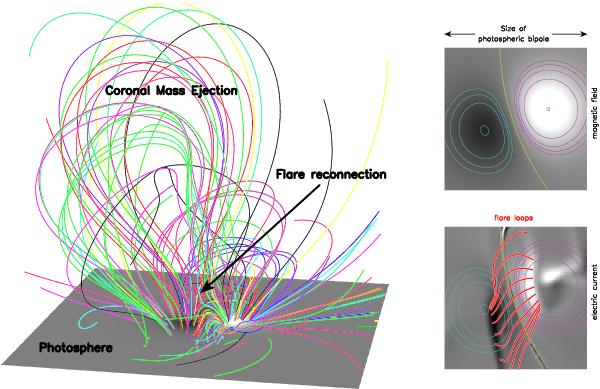
Eruptive flare model. (left:) projection view of randomly plotted coronal magnetic field lines. The grayscale corresponds to the vertical component of the photospheric magnetic field Bz. (right:) photospheric bipole viewed from above. The pink (resp. cyan) isocontours stand for positive (resp. negative) values of  . The yellow isocontour shows the polarity inversion line Bz = 0. (right-top:) the grayscale for Bz is the same as in the left panel. (right-bottom:) the grayscale shows the vertical component of the photospheric electric currents. Strong elongated white/black patches highlight flare ribbons. The red lines show representative post-reconnection flare loops, rooted in the flare ribbons.
Current usage metrics show cumulative count of Article Views (full-text article views including HTML views, PDF and ePub downloads, according to the available data) and Abstracts Views on Vision4Press platform.
Data correspond to usage on the plateform after 2015. The current usage metrics is available 48-96 hours after online publication and is updated daily on week days.
Initial download of the metrics may take a while.