Fig. 11
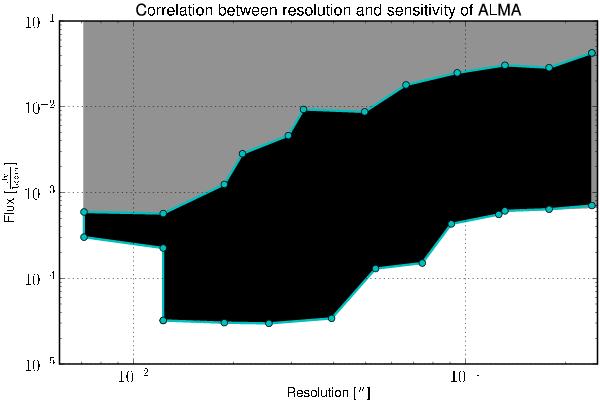
Overview of the correlation between resolution and sensitivity of ALMA. The resolution combines the observing wavelength and the ALMA array configuration. The dark area indicates 3σ-detections within an exposure time of two hours. In the gray area observations are possible, but were not calculated in the current study. The ALMA detection limit is determined by the lower edge of the dark area.
Current usage metrics show cumulative count of Article Views (full-text article views including HTML views, PDF and ePub downloads, according to the available data) and Abstracts Views on Vision4Press platform.
Data correspond to usage on the plateform after 2015. The current usage metrics is available 48-96 hours after online publication and is updated daily on week days.
Initial download of the metrics may take a while.