Fig. 7
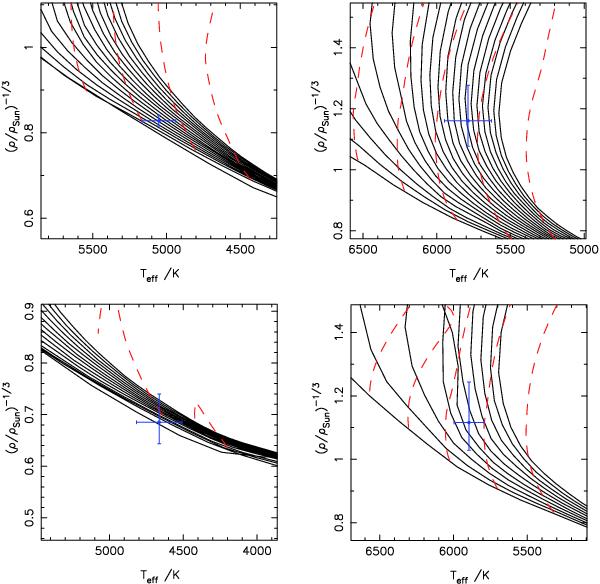
HR diagrams for WASP-52, 58, 59, and 60 (Yonsei-Yale stellar models). Each host star is denoted by a blue cross as a function of the stellar density and the effective temperature. Solid, black lines are the isochrones, and red, dashed lines are the evolutioanry tracks for different masses. WASP-52 (upper, left): 0.1 Gyr isochrone, and then 1 Gyr to 15 Gyr in 1 Gyr increments, and mass tracks from 1.0 to 0.7 M⊙ in 0.1 increments from left to right. WASP-58 (upper, right): 1 to 20 Gyr in 1 Gyr increment isochrones, and mass tracks from 1.1 to 0.7 M⊙ in 0.1 increments from left to right. WASP-59 (lower, left): 0.1, 0.4, 0.6 Gyr isochrones, then 1 Gyr to 10 Gyr in 1 Gyr increments, and 0.7 and 0.6 M⊙ mass tracks from left to right. WASP-60 (lower, right): 1 Gyr to 10 Gyr in 1 Gyr increments, and mass tracks from 1.3 to 0.70 M⊙ in 0.1 increments from left to right.
Current usage metrics show cumulative count of Article Views (full-text article views including HTML views, PDF and ePub downloads, according to the available data) and Abstracts Views on Vision4Press platform.
Data correspond to usage on the plateform after 2015. The current usage metrics is available 48-96 hours after online publication and is updated daily on week days.
Initial download of the metrics may take a while.