Fig. 4
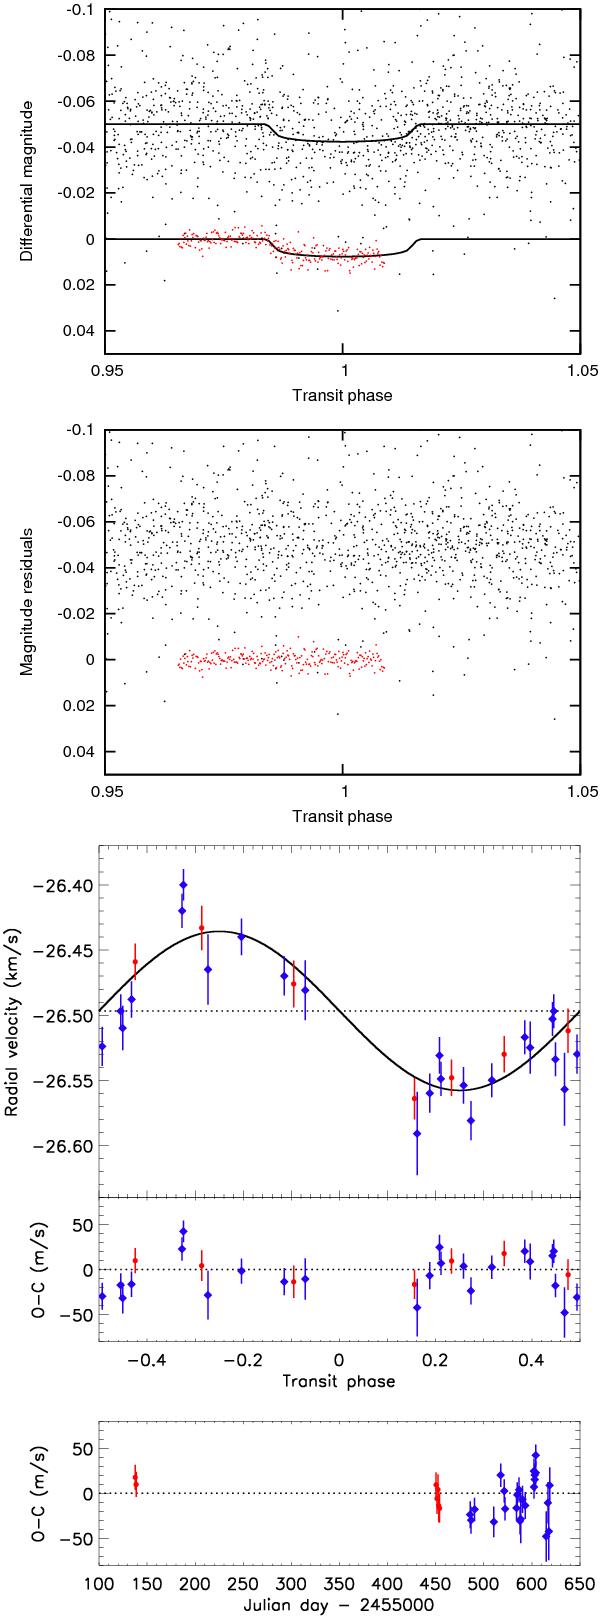
Photometry and radial velocities of WASP-60. The two upper panels show the SuperWASP-N (in black) and NITES (in red) transit light curves and their residuals from the fit. The three lower plots show the SOPHIE radial velocities and their residuals from the Keplerian fit. SOPHIE HE1 and H2 (see Table 4 and Sect. 2.2) are plotted in red circles and blue diamonds, respectively.
Current usage metrics show cumulative count of Article Views (full-text article views including HTML views, PDF and ePub downloads, according to the available data) and Abstracts Views on Vision4Press platform.
Data correspond to usage on the plateform after 2015. The current usage metrics is available 48-96 hours after online publication and is updated daily on week days.
Initial download of the metrics may take a while.