Fig. 6
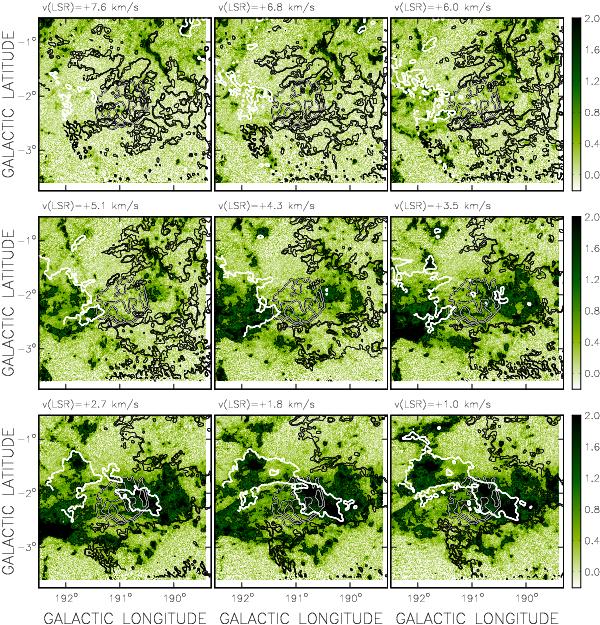
12CO line channel maps towards G190.9−2.2. The brightness scale is antenna temperature TA in K, and the resolution 1′. Three thick white-on-black contours traced at 100, 150 and 200 mK delineate the total power appearance of G152.4−2.1 at 21 cm. Extended HISA is contoured with thick pure white lines (level −20 K below the mean TB level of each H i channel), and H i emission at 6 and 9 Kelvin (above the mean of each map) is shown with the thin black contours. In channels with vLSR = +4.3 and 5.1 km s-1 molecular gas is seen bracketing the SNR’s east and west boundaries, and curved shell-like atomic gas clouds bracket the north and south boundaries.
Current usage metrics show cumulative count of Article Views (full-text article views including HTML views, PDF and ePub downloads, according to the available data) and Abstracts Views on Vision4Press platform.
Data correspond to usage on the plateform after 2015. The current usage metrics is available 48-96 hours after online publication and is updated daily on week days.
Initial download of the metrics may take a while.