Fig. 5
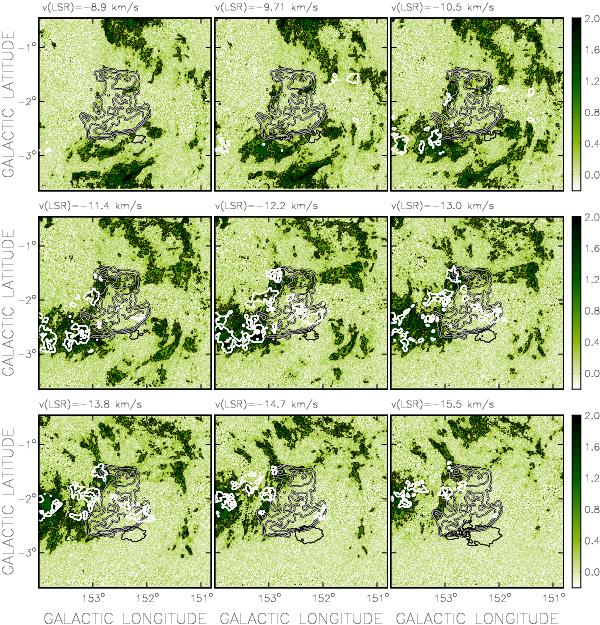
12CO line channel maps towards G152.4−2.1. The brightness scale is antenna temperature TA in K, and the angular resolution of the maps is 1′. Three thick white-on-black contours traced at 100, 130 and 160 mK delineate the total power appearance of G152.4−2.1 at 21 cm. Overlaid on each map are thick pure white contours that outline HISA clouds seen in CGPS H i maps at the same velocities. A single TB = 90 K contour (very thin black) outlines the brightest H i cloud in the field, appearing in between the molecular clouds that follow the outside of the southern shell. All of this activity peaks at vLSR = −12 km s-1.
Current usage metrics show cumulative count of Article Views (full-text article views including HTML views, PDF and ePub downloads, according to the available data) and Abstracts Views on Vision4Press platform.
Data correspond to usage on the plateform after 2015. The current usage metrics is available 48-96 hours after online publication and is updated daily on week days.
Initial download of the metrics may take a while.