Fig. 2
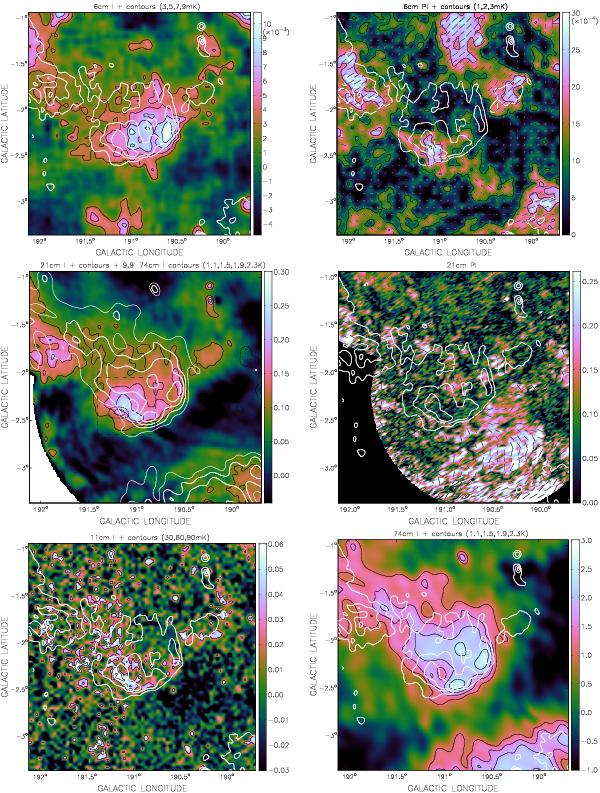
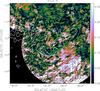
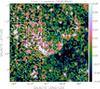
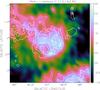
Total (I) and polarized intensity (PI) contoured maps of G190.9−2.2. The emission features (colour bars in brightness temperature units of K, at right) are themselves outlined in thin black contours (levels indicated in the text above each panel). B-field vectors are overlaid on PI maps (length proportional to PI; scale differs between maps). Resolutions are 9 5 (6 cm), 43 (11 cm, 21 cm I), 26 × 085 (21 cm PI), and 99 (74 cm). The box outline on the 21 cm panel corresponds to the optical image in Fig. 3; the elliptical patch of Hα emission identified in WHAM+VTSS data is also shown (dotted; 11,12 Rayleighs) on this panel. Three 21 cm contours (white) at 100,150, and 200 mK are shown overlaid on all maps, except the 21 cm panel which has white contours drawn from the 99 74 cm I map.
Current usage metrics show cumulative count of Article Views (full-text article views including HTML views, PDF and ePub downloads, according to the available data) and Abstracts Views on Vision4Press platform.
Data correspond to usage on the plateform after 2015. The current usage metrics is available 48-96 hours after online publication and is updated daily on week days.
Initial download of the metrics may take a while.