Fig. 2
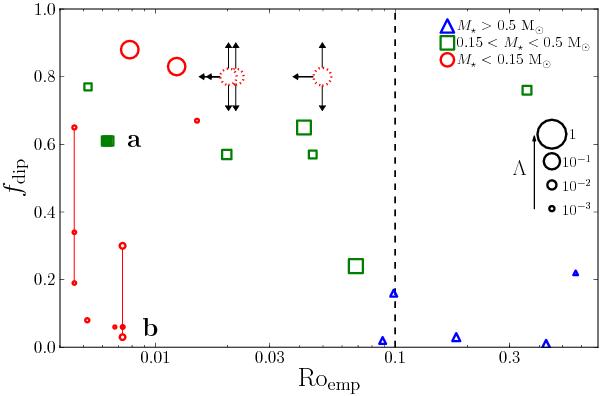
Observational counterpart of Fig. 1. The vertical dashed line marks the tentative limit for the dipolar regime. For the two stars exhibiting the largest temporal variations, the individual epochs are shown and connected by a vertical red line. Dotted red circles with black arrows correspond to stars from Morin et al. (2010) for which a definite ZDI reconstruction could not be achieved, but an upper limit for the rotation period and an estimate of dipolarity were derived. The two closed symbols correspond to two selected stars discussed in Fig. 4.
Current usage metrics show cumulative count of Article Views (full-text article views including HTML views, PDF and ePub downloads, according to the available data) and Abstracts Views on Vision4Press platform.
Data correspond to usage on the plateform after 2015. The current usage metrics is available 48-96 hours after online publication and is updated daily on week days.
Initial download of the metrics may take a while.