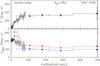
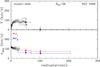
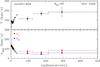
Fig. 9
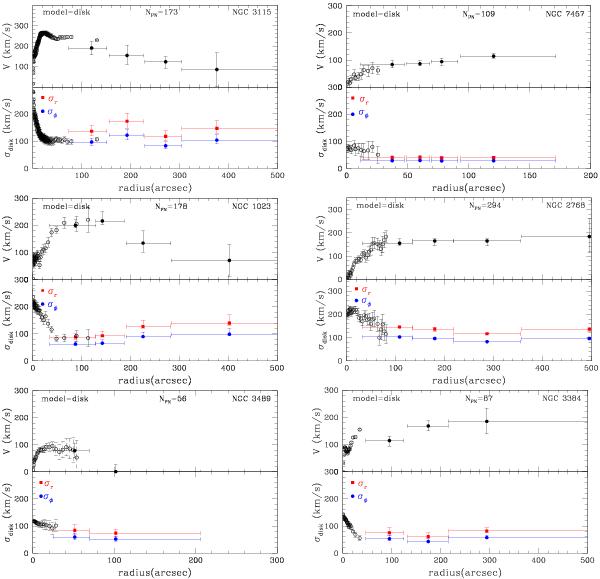
Kinematics of the S0 sample derived using the disk model of Cortesi et al. (2011). First row: field galaxies, second row: group members, third row: rich group members. The black circles show the average velocity in the bin (whose size is represented by the horizontal error bars). The red squares and blue circles show the velocity dispersion along the radial and azimuthal directions respectively. The stellar velocities and velocity dispersions obtained from absorption line spectra (Caon et al. 2000; Simien & Prugniel 1997; Norris et al. 2006; Fisher 1997) are shown as empty black circles. The number of PNe left after the clipping performed in each likelihood fit is annotated at the top of the corresponding panel.
Current usage metrics show cumulative count of Article Views (full-text article views including HTML views, PDF and ePub downloads, according to the available data) and Abstracts Views on Vision4Press platform.
Data correspond to usage on the plateform after 2015. The current usage metrics is available 48-96 hours after online publication and is updated daily on week days.
Initial download of the metrics may take a while.