Free Access
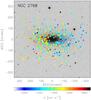
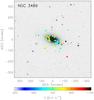
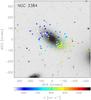
Fig. 8
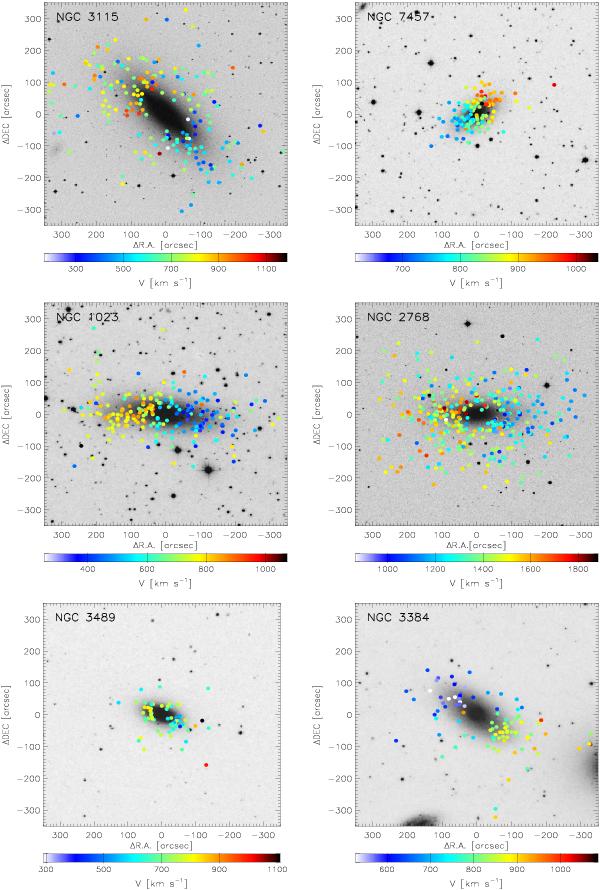
DSS images of the sample galaxies, with the PNe positions marked with circles. The colour of the circles represent the measured radial velocity of the PNe, according to the velocity scales below each panel. First row: field S0s, second row: S0s in groups, third row: S0s in rich groups.
This figure is made of several images, please see below:
Current usage metrics show cumulative count of Article Views (full-text article views including HTML views, PDF and ePub downloads, according to the available data) and Abstracts Views on Vision4Press platform.
Data correspond to usage on the plateform after 2015. The current usage metrics is available 48-96 hours after online publication and is updated daily on week days.
Initial download of the metrics may take a while.