Free Access
Fig. 9
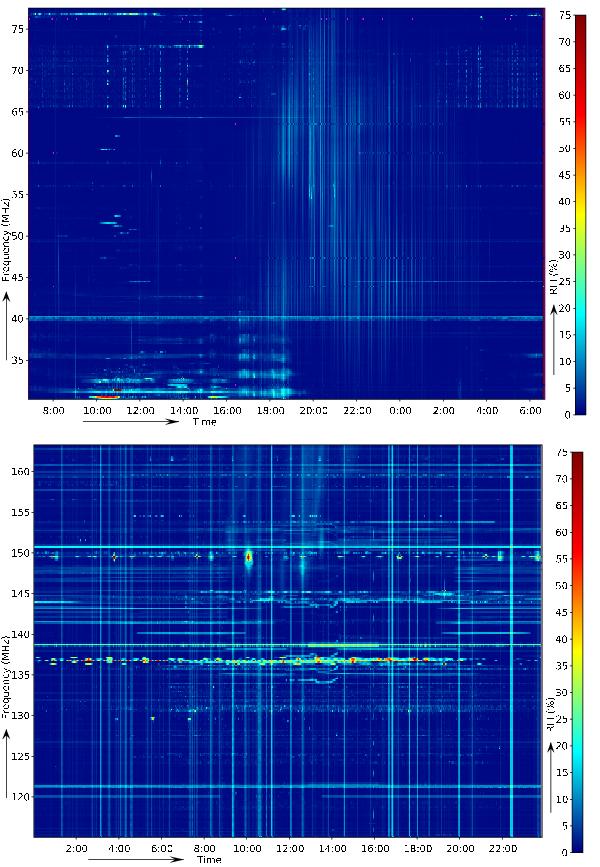
Dynamic RFI occupancy spectrum for the surveys. Colour intensity represents the fraction of samples that were occupied in a specific time-frequency bin. The average over all baselines is shown. Top: LBA, bottom: HBA. The broad-band features in the LBA are likely to be ionospheric effects on Cas A.
Current usage metrics show cumulative count of Article Views (full-text article views including HTML views, PDF and ePub downloads, according to the available data) and Abstracts Views on Vision4Press platform.
Data correspond to usage on the plateform after 2015. The current usage metrics is available 48-96 hours after online publication and is updated daily on week days.
Initial download of the metrics may take a while.