Fig. 14
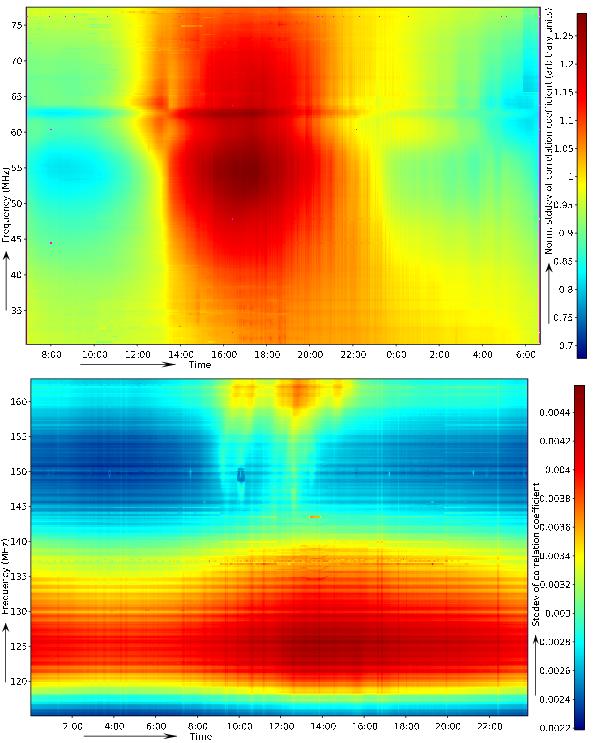
Standard deviation over time and frequency during the surveys. In the LBA set, the individual statistics of each sub-band were divided by the Winsorized mean of the sub-band, to correct for the antenna response on first order. In the LBA set, no residual RFI is visible, except some weak residuals near the edges of the band. A few purple dots can be seen in the data, which denotes missing data. The HBA set shows a bit more undetected, but weak RFI residuals.
Current usage metrics show cumulative count of Article Views (full-text article views including HTML views, PDF and ePub downloads, according to the available data) and Abstracts Views on Vision4Press platform.
Data correspond to usage on the plateform after 2015. The current usage metrics is available 48-96 hours after online publication and is updated daily on week days.
Initial download of the metrics may take a while.