Fig. 8
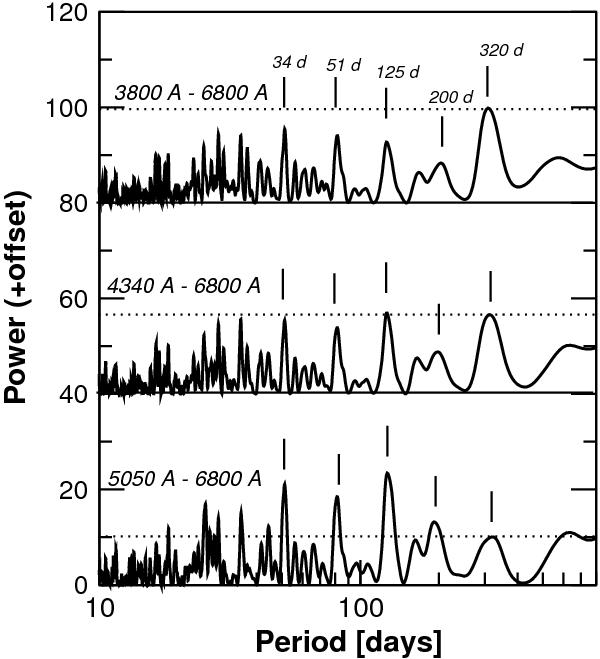
Residual periodogram of the three-planet solution as a function of the blue cut-off wavelength λBC. The top periodogram is obtained using the full-spectrum RVs. The bottom periodogram is obtained using the aperture 40 (505.0 nm) as λBC. All signals discussed in the text are marked with narrow vertical lines. The horizontal line represents the peak value of peak closer to 320 days. When λBC = 433 nm (central periodogram), the emerging 125-day peak is already as high as the activity-induced signal. The 120-day peak is an alias of the most likely period of 200 days for planet candidate d.
Current usage metrics show cumulative count of Article Views (full-text article views including HTML views, PDF and ePub downloads, according to the available data) and Abstracts Views on Vision4Press platform.
Data correspond to usage on the plateform after 2015. The current usage metrics is available 48-96 hours after online publication and is updated daily on week days.
Initial download of the metrics may take a while.