Free Access
Fig. 6
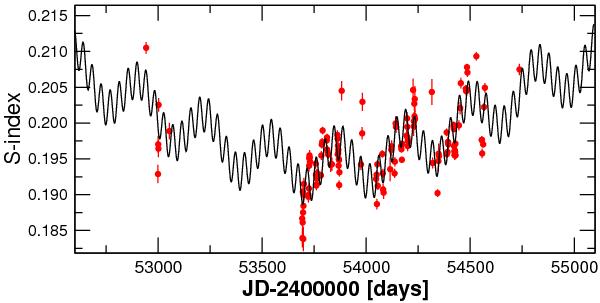
Time-series of the S-index. The solid black represents the best fit to a model containing three sinusoids (periods of 4000, 320, and 43 days). Long-period trend and two signals at 320 and 43 days are clearly detected in the time-series of the S-index.
Current usage metrics show cumulative count of Article Views (full-text article views including HTML views, PDF and ePub downloads, according to the available data) and Abstracts Views on Vision4Press platform.
Data correspond to usage on the plateform after 2015. The current usage metrics is available 48-96 hours after online publication and is updated daily on week days.
Initial download of the metrics may take a while.