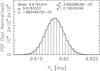
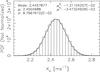
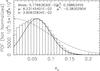
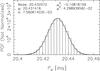
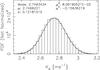
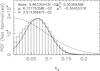
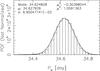
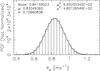
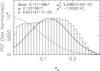
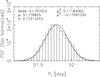
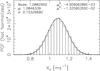
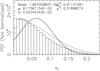
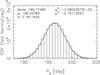
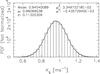
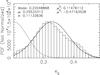
Fig. 13
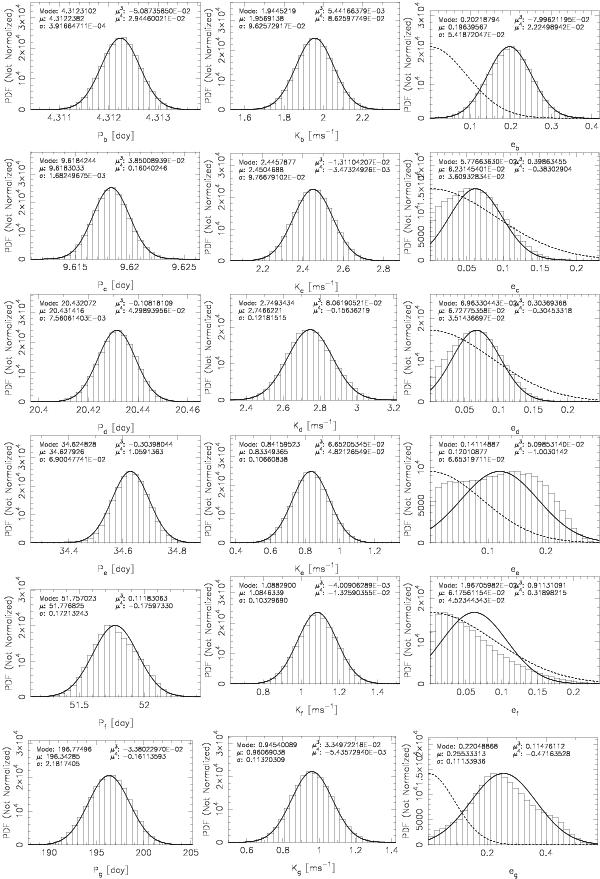
Distributions estimating the posterior densities of orbital periods (Px), eccentricities (ex), and radial velocity amplitudes (Kx) of the six Keplerian signals. The dashed lines show the prior densities for comparison for the orbital eccentricities. The solid curves are Gaussian densities with the same mean (μ) and variance (σ2) as the parameter distributions. Additional statistics, mode, skewness (μ3), and kurtosis (μ4) of the distributions are also shown.
Current usage metrics show cumulative count of Article Views (full-text article views including HTML views, PDF and ePub downloads, according to the available data) and Abstracts Views on Vision4Press platform.
Data correspond to usage on the plateform after 2015. The current usage metrics is available 48-96 hours after online publication and is updated daily on week days.
Initial download of the metrics may take a while.