Free Access
Fig. 1
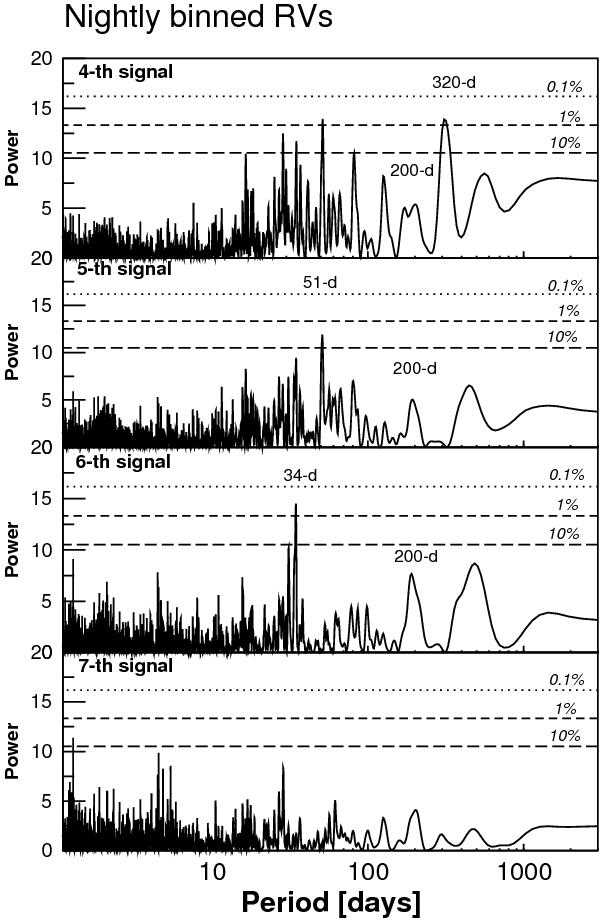
Least-squares periodograms of the binned HD 40307 radial velocities for the residuals of the models with three (top) to six (bottom) periodic signals. The analytic 10%, 1%, and 0.1% FAPs are shown as horizontal lines.
Current usage metrics show cumulative count of Article Views (full-text article views including HTML views, PDF and ePub downloads, according to the available data) and Abstracts Views on Vision4Press platform.
Data correspond to usage on the plateform after 2015. The current usage metrics is available 48-96 hours after online publication and is updated daily on week days.
Initial download of the metrics may take a while.