Fig. 3
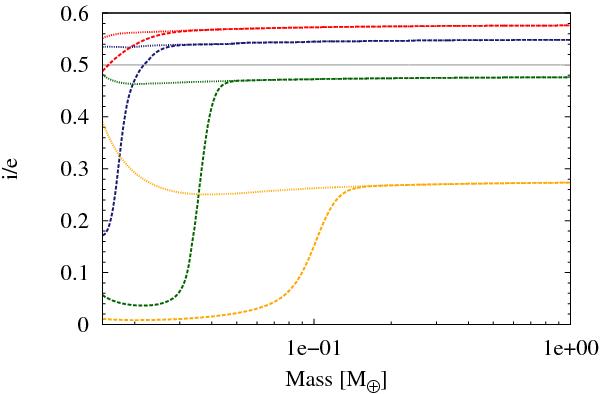
In situ formation of a 1 M⊕ planet at 6 AU for different radii of accreted planetesimals (red, 100 km; blue, 10 km; green, 1 km; orange, 0.1 km). The solid line is for the equilibrium approximation of eccentricities and inclinations (see Eqs. (56), (57)). The dashed and dotted lines are for the explicit calculation of e and i solving the differential equations Eqs. (31), (32). Two different initial values, e0, i0, were considered: the dashed line represents the case where e0 and i0 are given by Eqs. (59), (58), while the dotted line assumes e0, i0 to be the initial equilibrium values of the equilibrium case. The top-left panel depicts the mass growth of the protoplanet as a function of time. The top-right panel shows the time evolution of the eccentricity. The bottom-left panel shows the eccentricity as a function of the mass of the embryo. Clearly, in all cases, equilibrium is attained after an out of equilibrium state. The bottom-right panel plots the accretion rate of solids as a function of the embryo mass. Note that, as a function of the planet mass, the difference in the accretion rate is only a consequence of the difference in e and i.
Current usage metrics show cumulative count of Article Views (full-text article views including HTML views, PDF and ePub downloads, according to the available data) and Abstracts Views on Vision4Press platform.
Data correspond to usage on the plateform after 2015. The current usage metrics is available 48-96 hours after online publication and is updated daily on week days.
Initial download of the metrics may take a while.