Fig. 9
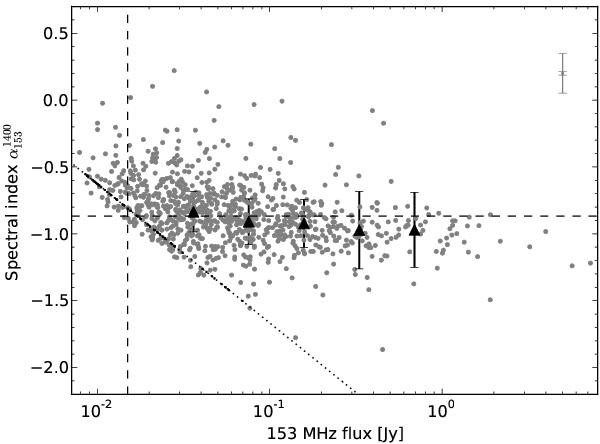
Spectral index,  , distribution of sources matched
between 1.4 GHz and 153 MHz (grey points). The difference in resolution is 45″
(NVSS) and 25″ (GMRT) and multiple GMRT matches to a single NVSS source have been
merged into one. The vertical line shows 5σavg, where
σavg is the average rms noise in the GMRT mosaic. The
diagonal dotted line indicates the incompleteness limit due to the sensitivity of
NVSS and sources with upper limits are plotted as black points along this line. The
horizontal dashed line shows the KM mean spectral index of −0.87 ± 0.01 accounting
for upper limits. The large black triangles show the mean spectral index in 5
logarithmic bins. Error bars on individual points are not plotted for clarity, but a
single bar in the top right indicates the maximum and minumum errors in the
dataset.
, distribution of sources matched
between 1.4 GHz and 153 MHz (grey points). The difference in resolution is 45″
(NVSS) and 25″ (GMRT) and multiple GMRT matches to a single NVSS source have been
merged into one. The vertical line shows 5σavg, where
σavg is the average rms noise in the GMRT mosaic. The
diagonal dotted line indicates the incompleteness limit due to the sensitivity of
NVSS and sources with upper limits are plotted as black points along this line. The
horizontal dashed line shows the KM mean spectral index of −0.87 ± 0.01 accounting
for upper limits. The large black triangles show the mean spectral index in 5
logarithmic bins. Error bars on individual points are not plotted for clarity, but a
single bar in the top right indicates the maximum and minumum errors in the
dataset.
Current usage metrics show cumulative count of Article Views (full-text article views including HTML views, PDF and ePub downloads, according to the available data) and Abstracts Views on Vision4Press platform.
Data correspond to usage on the plateform after 2015. The current usage metrics is available 48-96 hours after online publication and is updated daily on week days.
Initial download of the metrics may take a while.