Fig. 5
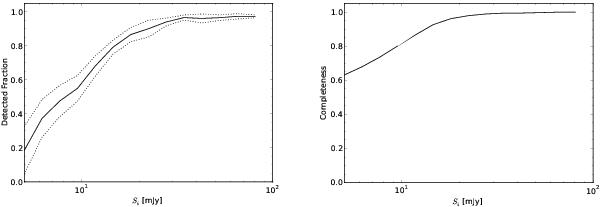
Left: fraction of sources detected as a function of integrated flux density to local noise ratio calculated from 25 Monte-Carlo simulations. The solid line shows the mean of all 25 randomly generated fields and the two dotted lines show the 1σ uncertainty. Right: estimated completeness of the catalogue as a function of integrated flux density limit accounting for the varying sensitivity across the field of view.
Current usage metrics show cumulative count of Article Views (full-text article views including HTML views, PDF and ePub downloads, according to the available data) and Abstracts Views on Vision4Press platform.
Data correspond to usage on the plateform after 2015. The current usage metrics is available 48-96 hours after online publication and is updated daily on week days.
Initial download of the metrics may take a while.