Fig. 12
Comparison between  and
and
 : histogram of
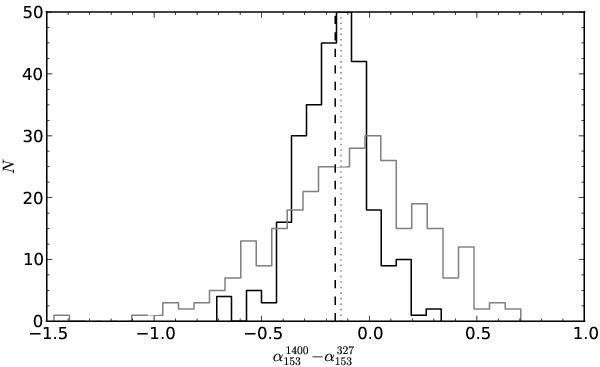
 . Again, the histogram for bright
GMRT sources is plotted in black and for fainter sources in grey. The dashed black
line shows the mean value of −0.25 and the grey dotted line, the mean value of −0.2,
for bright and all sources respectively, indicating that the majority of sources
have flattened spectra at low frequencies.
. Again, the histogram for bright
GMRT sources is plotted in black and for fainter sources in grey. The dashed black
line shows the mean value of −0.25 and the grey dotted line, the mean value of −0.2,
for bright and all sources respectively, indicating that the majority of sources
have flattened spectra at low frequencies.
Current usage metrics show cumulative count of Article Views (full-text article views including HTML views, PDF and ePub downloads, according to the available data) and Abstracts Views on Vision4Press platform.
Data correspond to usage on the plateform after 2015. The current usage metrics is available 48-96 hours after online publication and is updated daily on week days.
Initial download of the metrics may take a while.