Fig. 1
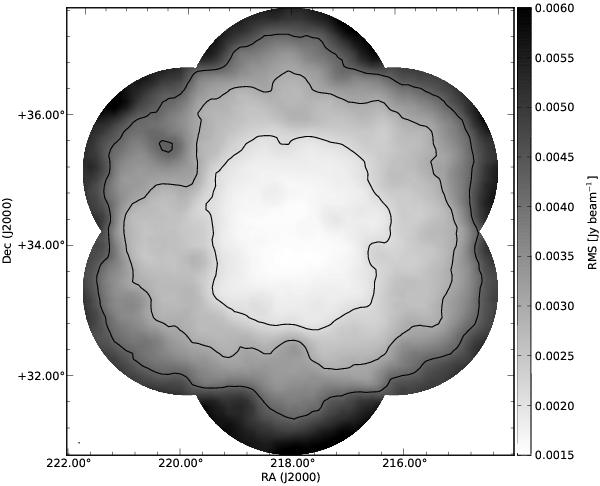
Greyscale map showing the local rms noise measured in the mosaic image. The
greyscale shows the rms noise from 0.5σavg to
2σavg, where
σavg = 3.0 mJy beam-1 is the approximate
rms in the mosaic centre. The contours are plotted at
 . Peaks in the local noise coincide
with the locations of bright sources.
. Peaks in the local noise coincide
with the locations of bright sources.
Current usage metrics show cumulative count of Article Views (full-text article views including HTML views, PDF and ePub downloads, according to the available data) and Abstracts Views on Vision4Press platform.
Data correspond to usage on the plateform after 2015. The current usage metrics is available 48-96 hours after online publication and is updated daily on week days.
Initial download of the metrics may take a while.