Fig. 8
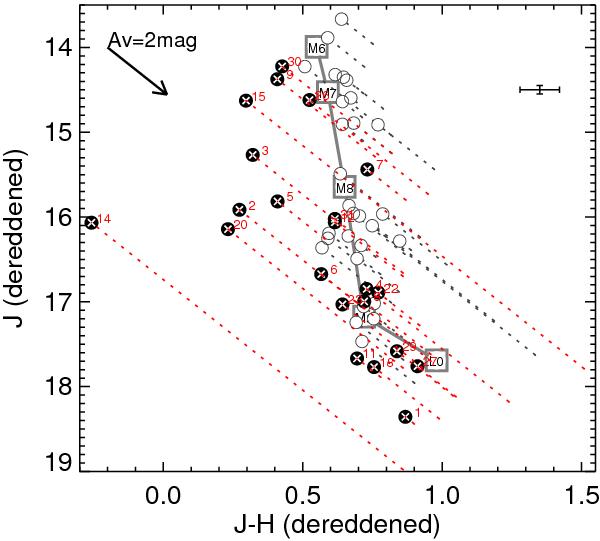
Colour–magnitude diagram for the previously known brown dwarfs from the literature and the new candidate members corrected for extinction. The solid line represents the 3 Myr isochrone at the distance of the cluster, obtained by combining empirical relations of young stellar objects, and the Dusty models of Chabrier et al. (2000). The dotted lines indicating the amount of extinction applied to each target. The typical error bar is shown.
Current usage metrics show cumulative count of Article Views (full-text article views including HTML views, PDF and ePub downloads, according to the available data) and Abstracts Views on Vision4Press platform.
Data correspond to usage on the plateform after 2015. The current usage metrics is available 48-96 hours after online publication and is updated daily on week days.
Initial download of the metrics may take a while.