Fig. 4
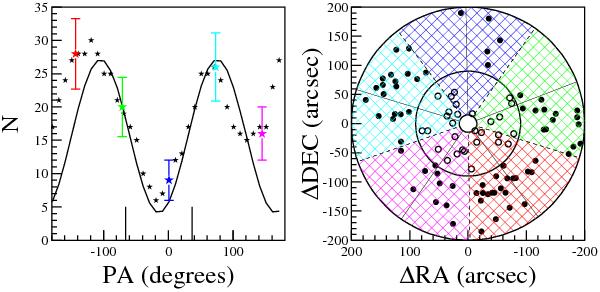
Two dust components that affect the Ciardullo et al. (1989) sample of planetary nebulae. We considered a complete sample of 99 planetary nebulae distributed into a 15–200 arcsec annulus. This annulus was split into five equal parts as indicated by the colors. The left panel displays the relation between the number N of planetary nebulae detected in each position angle. The color star points (in the left panel) correspond to the colored hatched areas displayed in the right panel. The black stars (in the left panel) were obtained with a running sum for different position angles (PA). The error bars indicated only for the color points correspond to Poisson statistical noise. The line corresponds to the multiplication of two sinusoids of phase PA = 37 deg and –66 deg, as indicated by the ticks at the bottom. The right panel displays the spatial distribution of the planetary nebula sample in the annuli, corresponding to the completeness limits (15, 90 and 200 arcsec).
Current usage metrics show cumulative count of Article Views (full-text article views including HTML views, PDF and ePub downloads, according to the available data) and Abstracts Views on Vision4Press platform.
Data correspond to usage on the plateform after 2015. The current usage metrics is available 48-96 hours after online publication and is updated daily on week days.
Initial download of the metrics may take a while.