Fig. 2
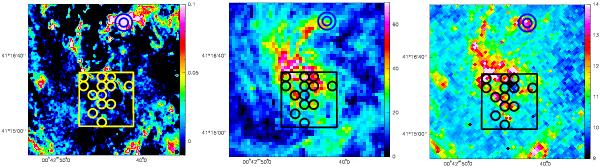
Field M 31-1a centered on RA: 00:42:44.1 and Dec: +41:15:42 (J2000) observed at IRAM-30 m HERA, superimposed on the A observed extinction map (Melchior et al. 2000, left panel), Hα and [NII] emission map (Ciardullo et al. 1988, middle panel), and 8 μm Spitzer emission map (Block et al. 2006, right panel). The circles correspond to the ≥ 3σ detections discussed in this paper.
Current usage metrics show cumulative count of Article Views (full-text article views including HTML views, PDF and ePub downloads, according to the available data) and Abstracts Views on Vision4Press platform.
Data correspond to usage on the plateform after 2015. The current usage metrics is available 48-96 hours after online publication and is updated daily on week days.
Initial download of the metrics may take a while.