Fig. 1
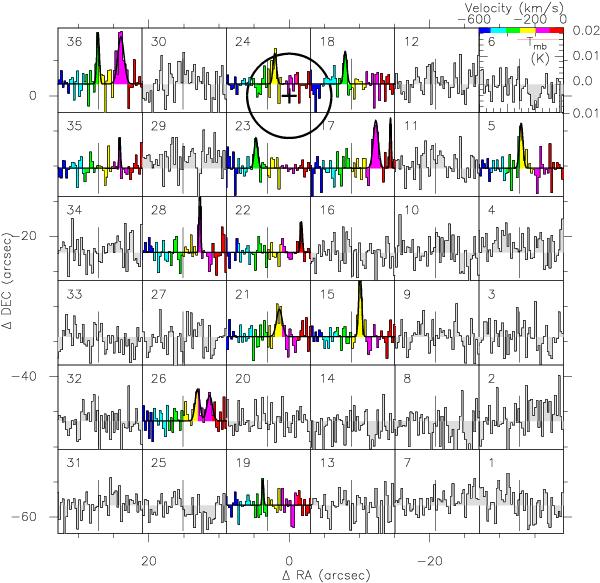
Field M 31-1a centered on RA: 00:42:44.1 and Dec: +41:15:42 (J2000) observed with IRAM-30 m/HERA. The center is indicated with a cross and the circle displays the 12′′ beam. The Y scale of each spectrum is in main-beam temperature (Tmb between –0.01 and 0.02 mK, as indicated on the top right corner), while the X-axis shows the velocity for the range between –600 and 0 kms-1 smoothed to 13 kms-1 velocity resolution. A thin line indicates the systemic velocity at −310 kms-1. The color-coding (displayed in the top right corner) of the velocity is used for the spectra with 3σ detections.
Current usage metrics show cumulative count of Article Views (full-text article views including HTML views, PDF and ePub downloads, according to the available data) and Abstracts Views on Vision4Press platform.
Data correspond to usage on the plateform after 2015. The current usage metrics is available 48-96 hours after online publication and is updated daily on week days.
Initial download of the metrics may take a while.