Fig. 5
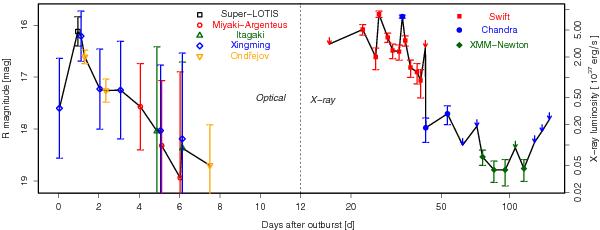
Light curve of nova M31N 2010-10f in the optical R band (left part, nova magnitude assuming Bol 126 having constant R = 16.7 mag) and in the X-ray range (right part), assuming a nova outburst on MJD = 55 480.32 (see text). Note the logarithmic luminosity scale for the X-ray light curve and that the scale of the ordinate changes from linear to logarithmic at day 12. Error bars show 1σ confidence range, down-pointing arrows indicate 3σ upper limits. Data from different observatories are colour- and symbol-coded.
Current usage metrics show cumulative count of Article Views (full-text article views including HTML views, PDF and ePub downloads, according to the available data) and Abstracts Views on Vision4Press platform.
Data correspond to usage on the plateform after 2015. The current usage metrics is available 48-96 hours after online publication and is updated daily on week days.
Initial download of the metrics may take a while.