Free Access
Fig. 2
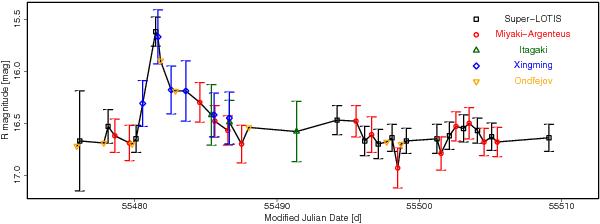
Optical R band light curve of Bol 126 consisting of data from five observatories indicated by different colours and symbols. One sigma confidence ranges are indicated by error bars. For the Ondřejov data the error ranges are about the size of the symbols.
Current usage metrics show cumulative count of Article Views (full-text article views including HTML views, PDF and ePub downloads, according to the available data) and Abstracts Views on Vision4Press platform.
Data correspond to usage on the plateform after 2015. The current usage metrics is available 48-96 hours after online publication and is updated daily on week days.
Initial download of the metrics may take a while.