Fig. 9
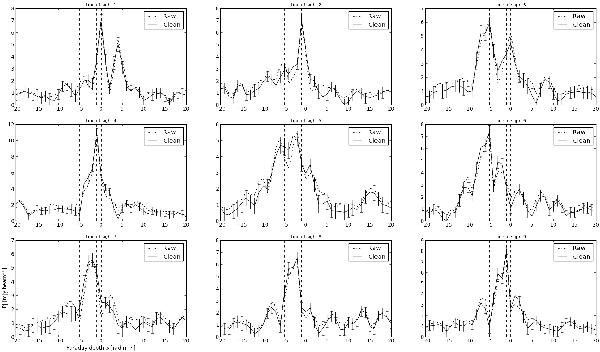
Faraday dispersion spectra of selected lines of sight labelled from 1 to 9 as in Fig. 8. The three dashed black lines point out the position of the histogram peak for the “bubble”, the “ring” and the “curtain” components. For each spectrum the “Clean” line is obtained from the “Raw” one by applying an RMCLEAN session with a threshold of 3 mJy beam-1. The noise level is shown by 1σ error bars.
Current usage metrics show cumulative count of Article Views (full-text article views including HTML views, PDF and ePub downloads, according to the available data) and Abstracts Views on Vision4Press platform.
Data correspond to usage on the plateform after 2015. The current usage metrics is available 48-96 hours after online publication and is updated daily on week days.
Initial download of the metrics may take a while.