Fig. 8
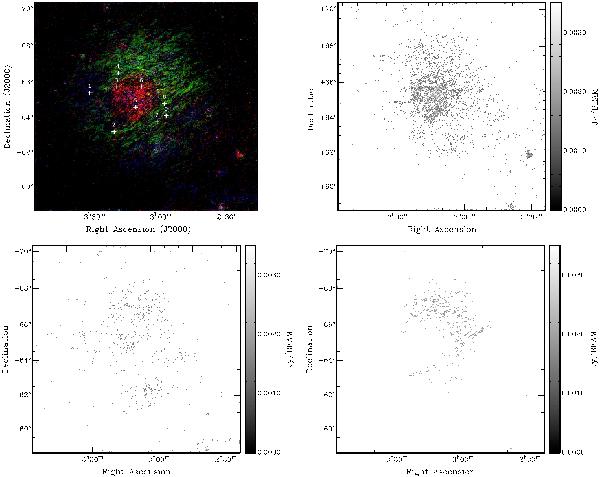
Composite image showing in the upper left panel a colour coded image of polarized intensity emission clipped at 3σ at three main Faraday depth ranges, where the white crosses denote the lines of sight used to extract the Faraday dispersion spectra in Fig. 9. PI clipped maps averaged over ranges in Faraday depth depicting the “bubble”, the “ring” and the “curtain” are shown clockwise in grey scale; red (upper right panel) is averaged PI over a range of φ ∈ [−13, −5] rad m-2, green (lower right panel) is averaged PI over a range of φ ∈ [−4, −1] rad m-2 and blue (lower left panel) is averaged PI over a range of φ ∈ [0, +5] rad m-2.
Current usage metrics show cumulative count of Article Views (full-text article views including HTML views, PDF and ePub downloads, according to the available data) and Abstracts Views on Vision4Press platform.
Data correspond to usage on the plateform after 2015. The current usage metrics is available 48-96 hours after online publication and is updated daily on week days.
Initial download of the metrics may take a while.