Fig. 5
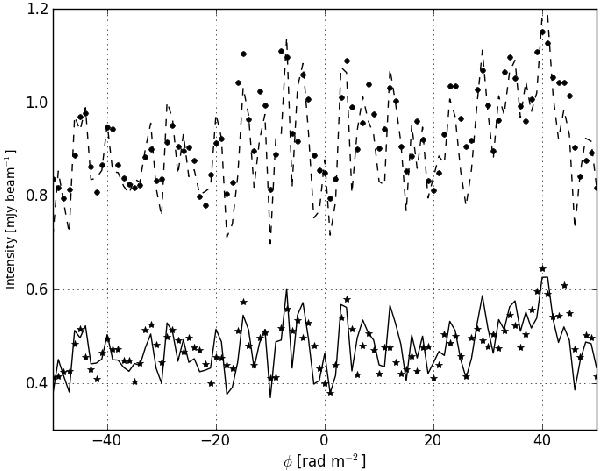
Noise behaviour in the PI map derived from a region denoted by box 1 in Fig. 2 as a function of Faraday depth under the assumption of Rayleigh distribution statistics. The expected mean and variance values of the noise are indicated by the dashed and solid lines, while the measured values indicated by circles and stars refer to the noise mean and variance, respectively.
Current usage metrics show cumulative count of Article Views (full-text article views including HTML views, PDF and ePub downloads, according to the available data) and Abstracts Views on Vision4Press platform.
Data correspond to usage on the plateform after 2015. The current usage metrics is available 48-96 hours after online publication and is updated daily on week days.
Initial download of the metrics may take a while.