Fig. 2
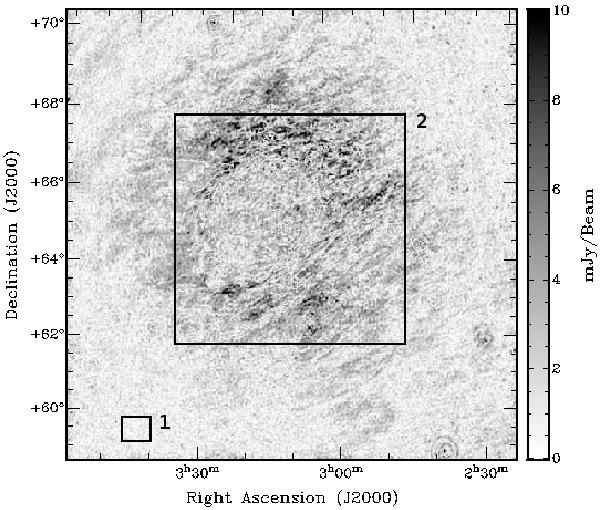
Frame of the RM-synthesis cube at Faraday depth
φ = −1 rad m-2 displaying the extended polarized
emission. Grating rings can be seen around the bright point sources at
 (close to the edge of the
image), and
(close to the edge of the
image), and  . The drawn boxes are chosen
to infer the noise behaviour (box 1) and derive the
cross-correlation profile (box 2), see text.
. The drawn boxes are chosen
to infer the noise behaviour (box 1) and derive the
cross-correlation profile (box 2), see text.
Current usage metrics show cumulative count of Article Views (full-text article views including HTML views, PDF and ePub downloads, according to the available data) and Abstracts Views on Vision4Press platform.
Data correspond to usage on the plateform after 2015. The current usage metrics is available 48-96 hours after online publication and is updated daily on week days.
Initial download of the metrics may take a while.