Fig. 15
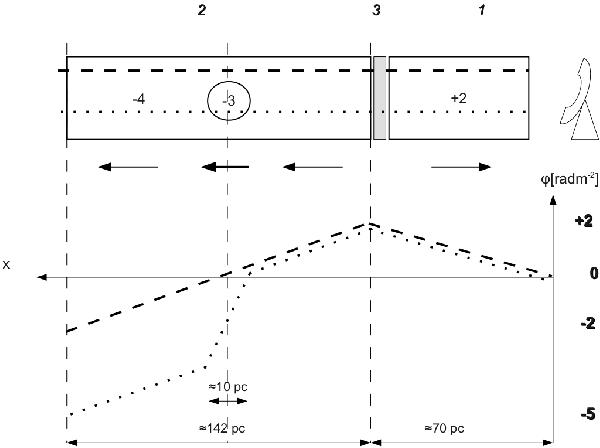
Cartoon illustrating the proposed model for the observed distribution of Faraday depths. Grey areas indicate only emitting regions, and white blocks indicate regions both emitting and Faraday rotating. Intrinsic Faraday depth values are shown within each structure in the top panel, and observed Faraday depth profiles are built up in the lower panel for two representative lines of sight: the dotted line crosses all the detected structures, the dashed line misses the “bubble”. Arrows in the top panel point out the magnitude and sign of neB∥.
Current usage metrics show cumulative count of Article Views (full-text article views including HTML views, PDF and ePub downloads, according to the available data) and Abstracts Views on Vision4Press platform.
Data correspond to usage on the plateform after 2015. The current usage metrics is available 48-96 hours after online publication and is updated daily on week days.
Initial download of the metrics may take a while.