Fig. 14
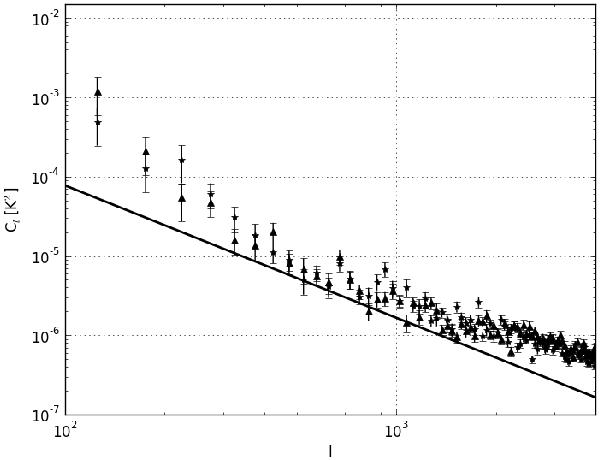
Power spectral density of polarized intensity of the “ring” (stars) and “bubble” (circles) components as derived from a 6 degree inner square of the PI images integrated over the relevant Faraday depths. Also statistical errors and the Kolmogorov spectral slope are shown by 1σ error bars and a black solid line, respectively.
Current usage metrics show cumulative count of Article Views (full-text article views including HTML views, PDF and ePub downloads, according to the available data) and Abstracts Views on Vision4Press platform.
Data correspond to usage on the plateform after 2015. The current usage metrics is available 48-96 hours after online publication and is updated daily on week days.
Initial download of the metrics may take a while.