Free Access
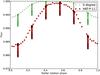
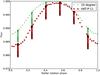
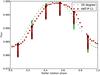
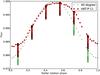
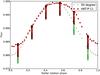
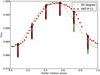
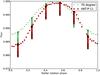
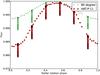
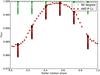
Fig. 7

Comparing SOAP-T’s photometric result with the observation of HAT-P-11 for the pole-on model of Sanchis-Ojeda & Winn (2011). Each panel shows different values for the latitude of one spot with the size of 0.2 radius of star. Green dot is the SOAP-T photometric result and red circle is the observation of HAT-P-11.
This figure is made of several images, please see below:

Current usage metrics show cumulative count of Article Views (full-text article views including HTML views, PDF and ePub downloads, according to the available data) and Abstracts Views on Vision4Press platform.
Data correspond to usage on the plateform after 2015. The current usage metrics is available 48-96 hours after online publication and is updated daily on week days.
Initial download of the metrics may take a while.