Fig. 5
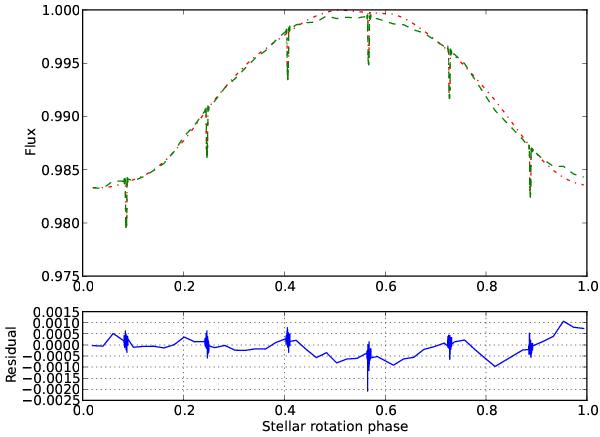
Comparing the best fit model to the transit photometry of HAT-P-11 using SOAP-T and the Kepler observation of HAT-P-11 for one period of stellar rotation. Red (dash-dotted) line shows SOAP-T’s photometric result for an edge-on solution and green (dashed) line correspond to HAT-P-11 observation. The blue (solid) line in the bottom panel shows the residual.
Current usage metrics show cumulative count of Article Views (full-text article views including HTML views, PDF and ePub downloads, according to the available data) and Abstracts Views on Vision4Press platform.
Data correspond to usage on the plateform after 2015. The current usage metrics is available 48-96 hours after online publication and is updated daily on week days.
Initial download of the metrics may take a while.