Fig. 9
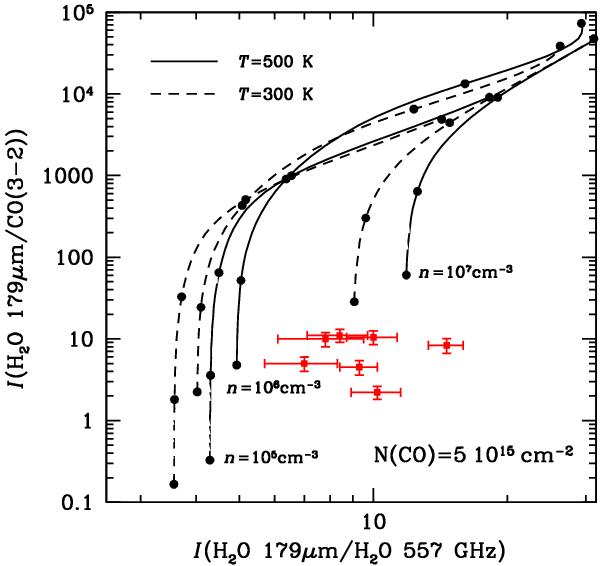
Diagnostic diagram employing the H2O 179 μm/557 GHz vs. the H2O 179 μm/CO(3–2) intensity ratios. Theoretical LVG predictions are plotted for the same parameters as in Fig. 8. The plot assumes a fixed N(CO) column density of 5 × 1015 cm-2 (see text for details). Data points refer to intensities measured in a beam of 38′′, equal to the beam of the 557 GHz observations.
Current usage metrics show cumulative count of Article Views (full-text article views including HTML views, PDF and ePub downloads, according to the available data) and Abstracts Views on Vision4Press platform.
Data correspond to usage on the plateform after 2015. The current usage metrics is available 48-96 hours after online publication and is updated daily on week days.
Initial download of the metrics may take a while.