Fig. 8
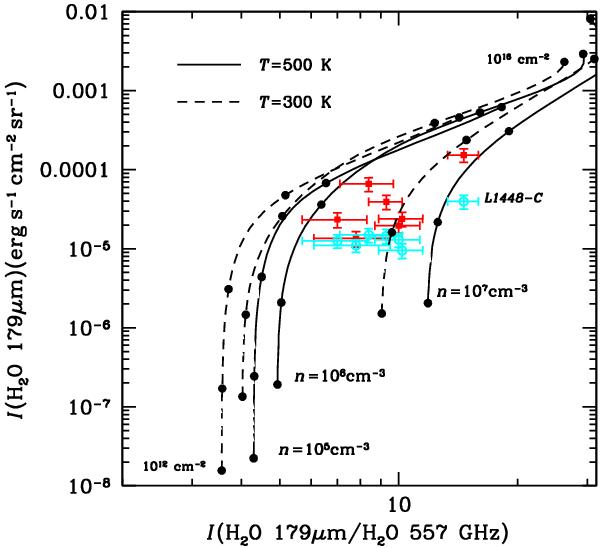
H2O 179 μm/557 GHz ratio vs. the H2O 179 μm intensity (expressed in erg s-1 cm-2 sr-1). Theoretical LVG predictions are plotted for volume densities of 105, 106 and 107 cm-3, and for kinetic temperatures of 300 K (dashed line) and 500 K (full line). Along each curve the N(o-H2O) column density varies from 1012 to 1016 cm-2 in steps of a factor 10. Open cyan circles refer to intensities measured in a beam of 38′′, equal to the beam size of the 557 GHz observations. Filled red circles plot the unconvolved PACS intensities. The data point for L1448-C is labeled.
Current usage metrics show cumulative count of Article Views (full-text article views including HTML views, PDF and ePub downloads, according to the available data) and Abstracts Views on Vision4Press platform.
Data correspond to usage on the plateform after 2015. The current usage metrics is available 48-96 hours after online publication and is updated daily on week days.
Initial download of the metrics may take a while.