Fig. 7
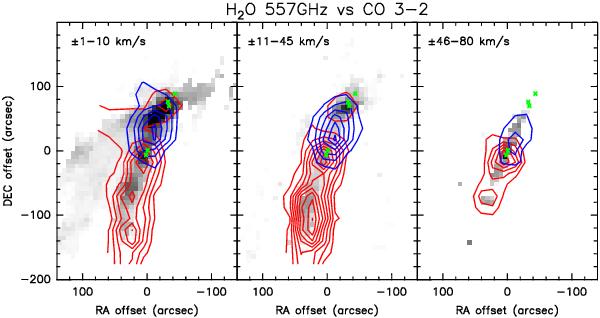
Contours of the H2O 110–101 emission integrated in three different velocity intervals, superimposed onto the CO(3–2) emission in the same velocity bins (gray scale). The velocity ranges with respect to the systemic velocity of VLSR = 4.7 km s-1, are shown in the upper side of each panel. Green crosses mark the positions of the different sources (see Fig. 1).
Current usage metrics show cumulative count of Article Views (full-text article views including HTML views, PDF and ePub downloads, according to the available data) and Abstracts Views on Vision4Press platform.
Data correspond to usage on the plateform after 2015. The current usage metrics is available 48-96 hours after online publication and is updated daily on week days.
Initial download of the metrics may take a while.