Fig. 4
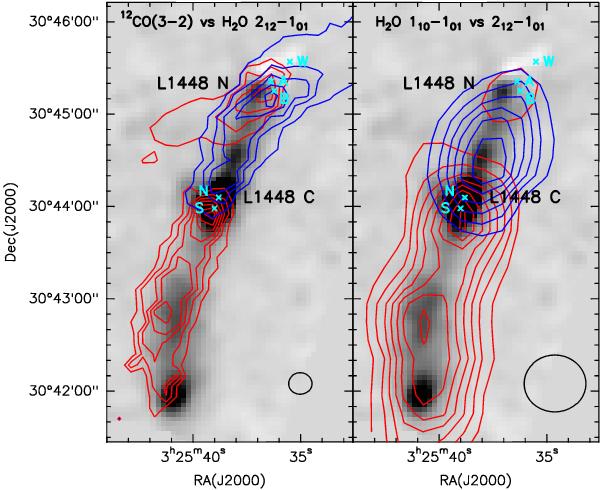
Overlay of the JCMT 12CO(3–2) (left panel) and HIFI H2O 557 GHz (right panel) emission on the H2O 179 μm map. The blue and red contours represent emission integrated in the velocity ranges (− 100, + 4) and (+ 6, + 100) km s-1, respectively. Contours are drawn from 25 to 200 K km s-1, with steps of 20 K km s-1, for the CO(3–2) map, and from 2 to 12 K km s-1, with steps of 1.2 K km s-1, for the H2O 557 GHz map. The HPBW of 14″ (JCMT) and 38″ (HIFI) is indicated.
Current usage metrics show cumulative count of Article Views (full-text article views including HTML views, PDF and ePub downloads, according to the available data) and Abstracts Views on Vision4Press platform.
Data correspond to usage on the plateform after 2015. The current usage metrics is available 48-96 hours after online publication and is updated daily on week days.
Initial download of the metrics may take a while.