Fig. 2
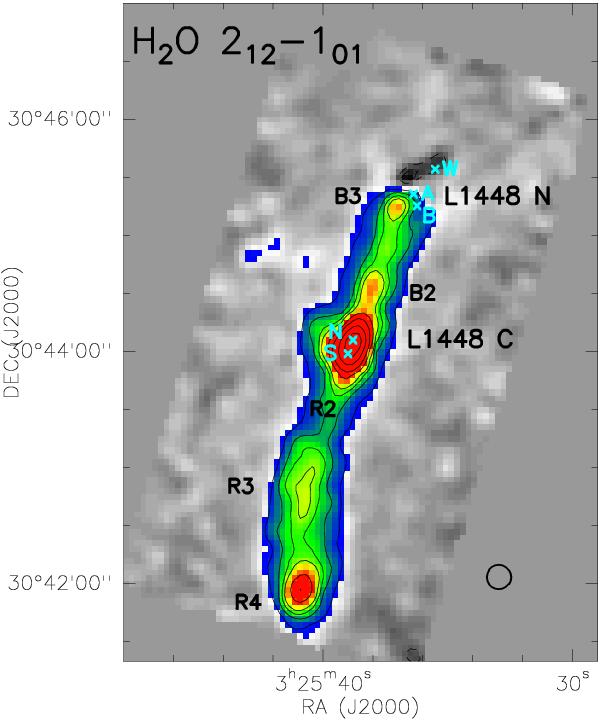
Continuum-subtracted PACS map of the integrated H2O 212–101 emission along the L1448 outflow. Sources in the region are indicated with crosses: L1448-C(S) and C(N) in the central region, and L1448 NA, NB, and NW in the northern region. The diffraction-limited beam of FWHM 12.6″ is also indicated. The different emission peaks are labeled following the nomenclature adopted by Bachiller et al. (1990) for individual CO peaks. The average rms noise in the observed region is of about 2 × 10⁻⁶ erg s-1 cm-2 sr-1. Contours are drawn at 3σ, 6σ, 9σ, 12σ, 16σ, 30σ, 50σ, and 75σ. Negative contours are indicated by dashed lines.
Current usage metrics show cumulative count of Article Views (full-text article views including HTML views, PDF and ePub downloads, according to the available data) and Abstracts Views on Vision4Press platform.
Data correspond to usage on the plateform after 2015. The current usage metrics is available 48-96 hours after online publication and is updated daily on week days.
Initial download of the metrics may take a while.