Fig. A.2
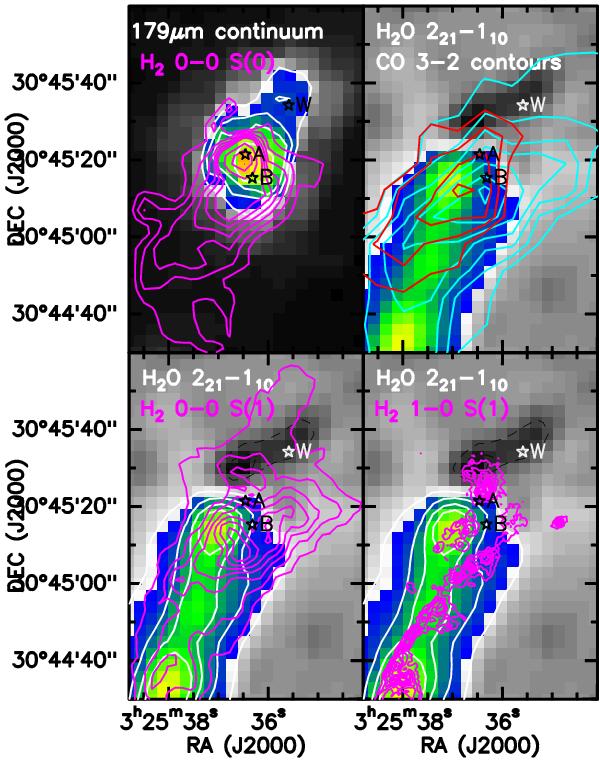
Same as Fig. A.1 for a region around L1448-N. In this case, white contours are drawn for the line and continuum emission with the following values: 0.6, 1.2, 1.8, 2.4, 4.0 × 10⁻⁵ erg s-1 cm-2 sr-1 (line) and 0.6, 0.8, 1.2, 1.6 × 10⁻³ erg s-1 cm-2 sr-1 (continuum). A contour of black broken line delineates the absorption region.
Current usage metrics show cumulative count of Article Views (full-text article views including HTML views, PDF and ePub downloads, according to the available data) and Abstracts Views on Vision4Press platform.
Data correspond to usage on the plateform after 2015. The current usage metrics is available 48-96 hours after online publication and is updated daily on week days.
Initial download of the metrics may take a while.